This is Part 8 of our Open Source Creator Series on to help you – the open source technology creators – understand and bootstrap some of the essential non-technical elements of building a successful project.
(See Part 1 – Licensing Fundamentals; Part 2 – Product Marketing; Part 3 - How to Choose an Open Source License; Part 4 -- Documentation and Technical Writing 101; Part 5 -- Understanding 'Distribution' in Open Source Licensing; Part 6 – How to Measure Community Building; Part 7 – Deriving Commercial Product from Open Source Project)
Back in February, I wrote a post on the three metrics to track and measure offline, in-person community building activities. Little did I (or the world) know that offline, in-person activities of any kind would become infeasible globally for the foreseeable future.
So I started thinking, with open source projects being default online and with everything else becoming more online and virtual, what should creators of open source technologies (that’s you!) measure as we continue in this COVID and (hopefully soon) post-COVID world?
There are plenty of metrics you can *track -- stars, forks, PRs/MRs, contributor counts, etc. -- **but more data doesn’t necessarily mean clearer insight*. I’ve personally shared my skepticism of the value of these surface-level metrics in the past, especially when assessing the health and sustainbility of an open source project.
In this post, I propose two second-order metrics to track, measure, and optimize over time to build a strong, self-sustaining open source community:
- Pull Requests or Merge Requests reviewers breakdown
- Leaderboard of different community interactions
Why These Two Metrics
The long-term goal of any open source community building is to reach a tipping point, where the project can live beyond the initial creators or maintainers’ day-to-day involvement. It’s an especially important goal if you also are building a company around that open source technology, whether bootstrapped or VC-backed. (Your company will eventually have to divert resources and people power to build commercial services or paid features.)
It’s a lofty goal that few projects achieve.**Meanwhile, maintainer burnout is a real problem. **The latest and most high-profiled example is the creator of Redis, Salvatore Sanfilippo, sharing his struggles as an open source maintainer last year and eventually bowing out as CEO of Redis Labs earlier this year. Maintainers of various projects big or small are struggling through similar challenges every day.
I think focusing on the two metrics I proposed, especially early on in your open source journey, can increase your odds of building something sustainable, because they illuminate two important elements that drive sustainability: ownership and incentive.
PRs/MRs reviewers breakdown => Ownership: tracking who in your community are actively reviewing contributions is a good indicator of ownership. In the beginning, you, the creator, will be doing the bulk of the reviewing; that will be unsustainable over time. Being intentional about building your community so more people have the contextual knowledge, confidence, and welcoming attitude to review incoming PRs/MRs, which should increase in frequency as your project gains traction, is crucial to long-term sustainability.
There’s a customer service-like element to reviewing contributions, which can deteriorate if not enough people feel the ownership to do it. And one of the worst signals you can give to an otherwise enthusiastic new-comer is a PR or MR unattended for two or more weeks.
Leaderboard of different community interactions => Incentive: **Tracking a few community-facing interactions and possibly gamifying them within your community with rewards, can help drive the right incentives and behaviors of community members of all levels of experiences.Some of the interactions you can track are: number of PRs/MRs filed, comments, reactions, reviews (so some overlap with the previous metric). These interactions may have different values and quality, but the bigger goal here is **to understand who’s doing what, who’s good at doing what, and intentionally foster more behaviors based on people’s strengths and interests.
Perhaps some people are great at providing helpful comments, but don’t have enough context (yet) to review a PR/MR. It would be good to identify who they are and provide them with more info, so they can be a reviewer one day. Perhaps some people are super engaged with monitoring the project, shown by frequent reactions, but don’t feel comfortable yet chiming in with comments and suggestions. It would be good to know who *they *are and help them with more context to the project’s inner workings, so they can add more value to a community they clearly care about. I hope you get the general idea.
So how do you actually track and read into these metrics? Let’s illustrate with a comparison example between two open source projects: Kong and Apache Pulsar.
Kong (2014) and Apache Pulsar (2016)
Earlier in May, I used an open source data visualization tool called Apache Superset, along with a tutorial written by one of the project’s creators, Max Beauchemin (@mistercrunch), to crawl and visualize some of the data of Kong (an API gateway), Apache Pulsar (a pub-sub messaging system), and a few other projects. Using the tutorial, I crawled two years worth of data (from May 2018 - May 2020) to see change over time. (Note: the tutorial is an example of Superset’s own data with some hard-coded linkage to its history inside Airbnb and Lyft, so to use it, you will need to do some customization of the dashboard JSON to make it work more generally.)
Some context before we see the charts. First, the data was gathered back in May, so surely they will look different today. Second, this comparison is not a judgment on the current state or potential of either project. The two projects were open sourced at different times: Kong’s first commit was in November 2014 and Pulsar’s was in September 2016. (Of course, both were worked on in private before being open sourced.) Some of the differences you will see may simply be due to the passage of time and community effort paying off at different times; community building is a long, persistent slog.
Below are two charts of Kong and Pulsar’s PR reviews by GitHub handle, respectively:


*My observations: **Kong has a better balance of people who are reviewing PRs than Pulsar. That balance was achieved over time, as the Kong project grew in maturity. The most important thing to note is that neither Aghi (@sonicaghi) nor Marco (@subnetmarco), the creators of Kong, was anywhere close to being the top reviewers. *That’s a good thing! They certainly were during the early days, but their involvements became less visible as the project matured, as they should. Pulsar, as a younger project, isn’t at the same level yet, but is on its way to achieving that balance. Sijie (@sijie), Jia (@jiazhai), and Penghui (@codelipenghui) are doing the bulk of the reviewing for now; all three are PMC members of the project and lead SteamNative, the COSS company of Pulsar. Other major players like Splunk, especially after its aquisition of Streamlio, also contribute to the project, which is a good leading indicator of eventually achieving balance. (Note: one factor I’m intentionally glossing over is the difference in the governance process of an Apache Software Foundation project and a non-ASF project, which would impact the speed and procedure in which a contributor becomes a reviewer or maintainer. In that regard, this comparison is not 100% apples-to-apples.)
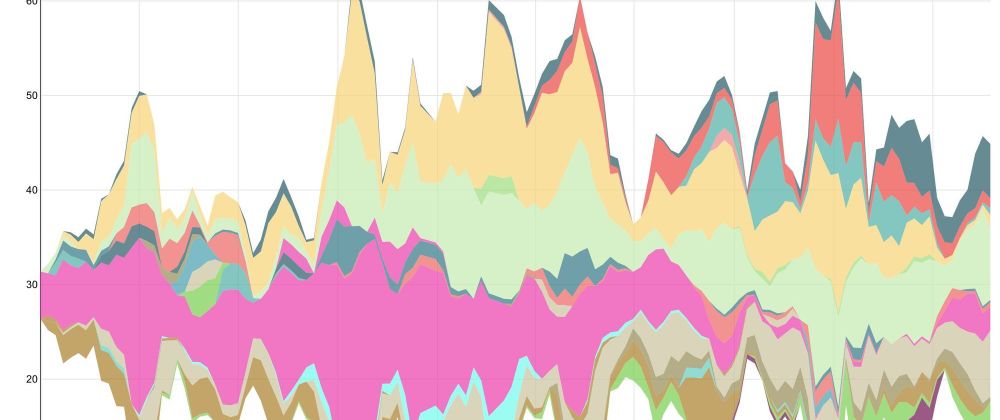
Below are two leaderboard charts of Kong and Pulsar’s community interactions by GitHub handle, respectively, of the last 90 days since the most recent data gathered, so roughly from March - May 2020:


My observations: these two leaderboards reflect the same “level of balance” that was shown in the previous chart already, which makes sense. The more interesting takeaway is who is doing which kind of interaction, how much interacting *is happening, and who seems to be doing it all (@sijie!). As far as building the right incentive structure goes, this leaderboard-type view can help you get a sense of where the interactions are coming from and what sort of reward or motivational system you want to design to accelerate positive behaviors.* Also, this data is useful for both internal management and external community building.** As close watchers of both Kong and Pulsar can tell, many of the leaders on these charts are employees of the COSS companies of the two projects, Kong Inc. and StreamNative. It’s quite common for active community contributors (or just enthusiasts) to become employees of the company commercializing the project. Regardless of where these folks are employed, to foster a sustainable project beyond its initial creators (which in turn would influence the sustainability of the COSS company), the behavior to measure, track, and incentivize are the same.
(Note: I’m aware that the Pulsar chart does not have a “reactions” column, which could either be because there wasn’t much reactions data to merit a top-10 entry or my own faulty configuration of the chart. I apologize for that inconsistency!)
Tips on Driving Balanced Sustainability
No matter how pretty the charts are, data doesn’t tell the whole story. And no matter how successful one particular project is, its experience should not be templatized to apply directly to a different project. That being said, I’d like to share a few actionable tips I’ve seen work in the wild that can help you improve these two metrics over time:
- High quality documentation:Part 4 of this Creator Series was focused on documentation, so I encourage you to give it a read. The one point worth double-clicking on is: a project’s documentation gets the most amount of traffic. It’s the place where people decide whether to continue learning about your project or move on. You never want to give people a reason to move on. Generally, I recommend spending 10-20% of your time writing documentation. Putting it in context: if you are working on your project full-time, it’s about half a day to one full day per week.
- Make “Contributor Guide” a living document: every project has a CONTRIBUTING.MD document (or variations of it). But projects who grow and mature make that document the best it can be and are always refreshing, updating, and refining it. Why? Because that’s where people who are enthusiastic about participating in the project go. If the guide is clear, succinct, and actionable, you’ll get contributions in no time. If it’s outdated, convoluted, and lacking an easy “on-ramp” (e.g., beginner issues, simple bugs, etc.), then that same enthusiasm will go somewhere else. Make your CONTRIBUTING.MD a killer feature.
- Set clear quality guidelines: there is such a thing as “noisy contribution” -- low quality PRs/MRs that require more energy than it’s worth to review and oftentimes reject. However, the responsibility of communicating to the public what is and is not “quality contribution” is on you, the creator or maintainer, because you have the most context and institutional knowledge of the project, by far. Make your expectations clear and don’t compromise on the quality. Make it a prominent section of your CONTRIBUTING.MD or a separate document to give it more visibility. Combine it with your project’s roadmap, which should be part of your public documentation anyway, so your new contributors know what’s expected of them and why.
I hope this post provides some useful insight on the two second-order metrics that matter, when building a sustainable open source community, and actionable items on how you can track and improve them. If you have thoughts, feedbacks, and critiques, don’t hesitate to share them with me on [Twitter**](https://twitter.com/kevinsxu), [LinkedIn*](https://www.linkedin.com/in/kevinsxu/)* or email (kx [AT] oss [DOT] capital). Good luck!**


Top comments (0)